Declan Lynch has been writing a very comprehensive introduction to Java for XPages developers. I would strongly encourage it for any XPages developer. Like many Domino Developers, my Java experience was limited at best prior to XPages, but a knowledge of Java opens up a door to greater power. You can take advantage of managed beans, VariableResolvers, ValueChangeListeners, Controllers and other objects that are the bedrock upon which XPages is built. You can take advantage of a wealth of resources from outside of Domino with greater confidence such as date formatting classes, pre-created code for building spreadsheets, documents or PDFs. You can extend Extension Library objects like the UserBean (Declan’s recent posts show how to extend classes). You can start to build OSGi plugins to make your own code more reusable. You can build OSGi Tasklets taking advantage of DOTS.
Of course, I’m not advocating diving straight into a complex OSGi plugin or DOTS tasklet. As with XPages in general, minimising complexity and unfamiliarity helps make it easier to understand what’s happening and build successful code.
And talking of building successful code, one of the main reasons I prefer Java – even after using Domino Designer 9.0 for many months, both in public and private beta, with its SSJS debugger – is the Java debugger.
There are two steps to enabling the Java debugger. The first step is adding two lines into the notes.ini:
JavaEnableDebug=1
JavaDebugOptions=transport=dt_socket,server=y,suspend=n,address=8000
The first line enables the Java debugger. The second gives settings, including the port number the server listens on and the Domino Designer client connects on. So your Domino administrator will need to allow access on that port. The server will need restarting to pick up the changed settings. When the HTTP task starts you will see the following message on the server console:
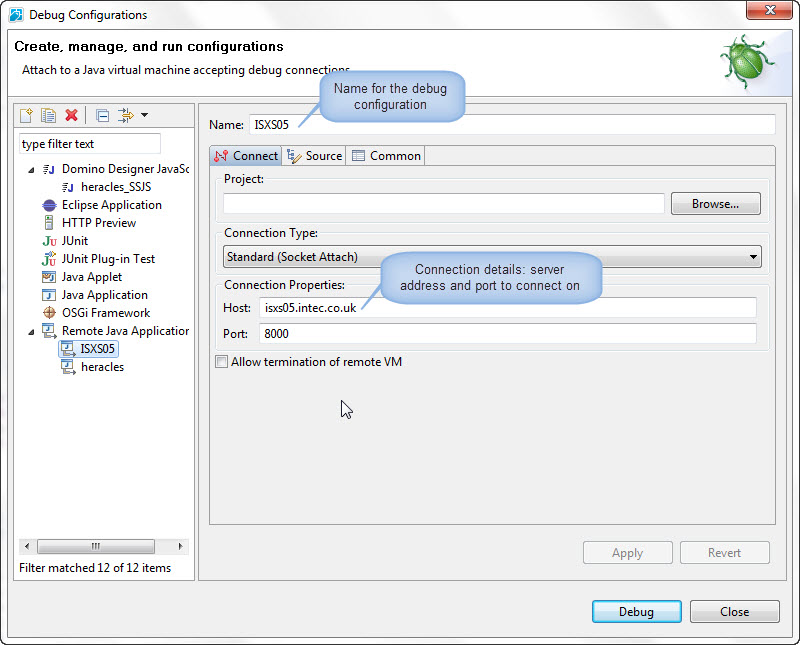
The second step is to create a debug configuration in Domino Designer. From the Run menu select Debug Configurations…. You’re connecting to a Remote Java Application – XPages. So right-click on that and select New. The debug configuration needs a name, so you know which server you’re connecting to. Then you need to add the host name for the server and port number it’s listening on – the same port you put in the notes.ini.
You’re now ready to debug your Java code. Unlike the LotusScript debugger, the Java debugger only launches when it hits a breakpoint. So a breakpoint needs adding to your code, by double-clicking in the left-hand margin of your Java code at the line you want to pause. You’ll see the blue circle that denotes the breakpoint. Double-clicking on it again will remove the breakpoint.
So far you’ve started the server listening, set up a configuration, and set up a debug point. But the debugger has not been started. You can do that from the debug configuration by clicking on the Debug button or by selecting the relevant configuration from the debug toolbar button.
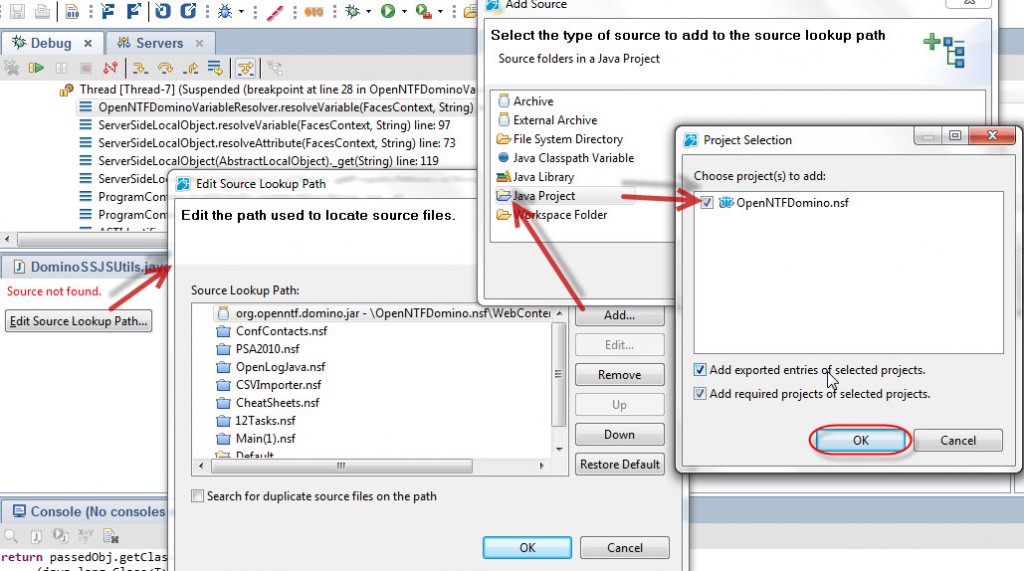
Note that only one person can connect a debugger to the server at any one time. Equally, you can’t connect the SSJS debugger while the Java debugger is connected, and vice versa. Once the debugger is connected and someone accesses an XPage where code hits the breakpoint, you will be switched to the debug perspective in Domino Designer. But the first time the debugger stops in an application you haven’t debugged before, you get a message Source not found with a button Edit Source Lookup Path. Looks scary, but it’s just saying you need to tell the debugger where to find the source code for the Java application it’s debugging – the Java application here is your NSF and the source code is already part of that NSF. Click on the button and add a Java Project, selecting the NSF you want to debug.
The debug perspective will now show your code stopped at the breakpoint. Now you can step through your code and check variables.
Clicking on a variable in the Variables view will allow you to see the value. You may need to increase the height of the window immediately below to see the value. The central portion shows you your code and the hierarchy of your Java class and the method being processed. Hovering on any variable that has already been processed will bring up a window with the same information available in the Variables pane. If you click on this window you can resize it as required and also, in the lower portion of the window, see the variable’s current value.
The bottom portion shows the Console view and the Tasks view. You really want to make one addition to this: select Window > Show Eclipse Views > Display. This is an extremely powerful view. It allows you to write Java including a return statement. When you highlight that code – a single line or multiple lines and click the second button, it will execute and write out the return value. This allows you to check properties, methods, running over variables already set from your code. It is invaluable in checking values. However, note that as soon as your code hits a catch block, the variables are no longer available. So you’ll want to use the Display view before it hits an error.
One final point to note.
Those of you who studied the code above will have noticed it’s creating two DateTime objects and calling methods over them, including a DateTime.isBefore(DateTime) method. Except they’re not lotus.domino.DateTime objects, because that doesn’t have an isBefore() method. They’re org.openntf.domino.impl.DateTime objects. Which does. Because we’ve added it!
The project is still in development at this time, but it’s intended to remove the need to recycle Domino objects, use Java collections to make looping quicker to implement and standardised with iterating other Java collections and add new functionality – like storing MIME, logging, new methods for standard Domino objects, graph database backends. The code base is also intended to be available not only from XPages, but Java agents, addins, servlets, applets, OSGi plugins, DOTS tasklets, even standalone potentially. We’re also working hard to try to make it available from SSJS (which may or may not be feasible at this point, there are some technical challenges to overcome), to make it even more accessible.
Needless to say, we’re all enthused about the project, none of which we could have done if we had not made the leap into Java and built up our experience in XPages. Nor could it have been done if IBM had given us this extensible platform and encouraged us to get into Java. As I said at the start of this post, I had minimal Java experience before XPages – two sessions on an evening course and fumbling through a plugin. Without XPages I would not have had the exposure to be able to get involved in the project. This project and the Java experience – started with beans, through Phase Listeners, Variable Resolvers, OSGi plugins and beyond – have shown me that we have a platform where the sky’s the limit. XPages alone gives us great power. XPages with Java gives us so much more.


My issue is that multiple JVMs sill start listening to that port (non exclusive listen) and you can decide where your debugger will attach to
Very true. But that is one of a number of reasons I’ve started developing on a local server. It also makes it important to clean up breakpoints after you’ve finished. But breakpoints can also be configured to be more flexible, using the breakpoints view.
Great write up. Have you had any success with debugging an OSGi plugin in Eclipse with 9.0? I took a working 8.5.3 environment (in a VM) and cloned it then upgraded it to 9.0 and can’t seem to get things to work anymore. I think maybe there’s an incompatibility with the debug plugin?
I can’t remember debugging an OSGi plugin. Usually I develop things like VariableResolvers or components in an NSF, then move them to a plugin once I’m happy everything works. Nathan has just added org.openntf.domino as a plugin in his branch of the project, so I may be using it. It’s worth asking that question on StackOverflow, because that will get the attention of the wider community, because I know quite a few advanced XPages developers are doing quite a bit with OSGi plugins.
Thanks for your insight and suggestion. I’ll try that route. 🙂
Tried this on 8.5.3 against code in a Java design element loaded as a bean. No love; breakpoints in multiple places (constructor, method called in bPL) are ignored. Maybe it doesn’t work on beans?
‘Twas a firewall issue. D’oh! This works completely as advertised.